User Documentation
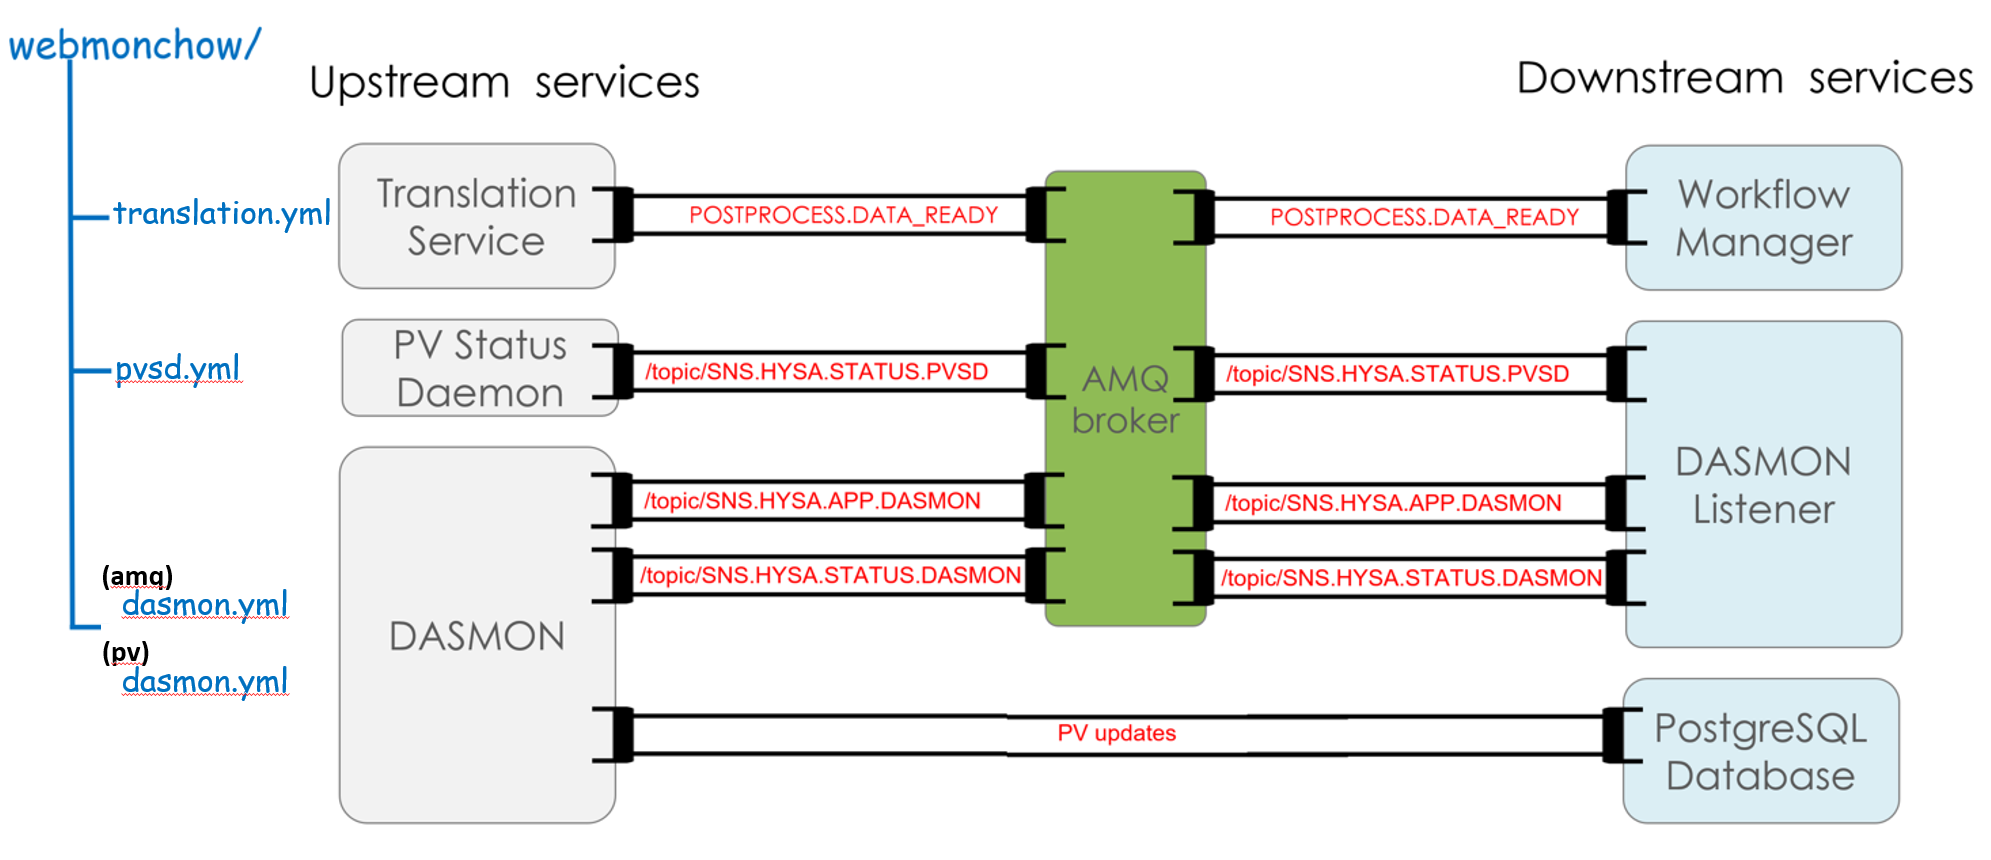
Webmonchow mimics three services (translation, pvsd, dasmon) that generate AMQ messages and process variables (PV) updates. These services provide the feed to three of the components spawned by the data_workflow package, namely the workflow-manager, the dasmon-listener, and the PostrgreSQL database.
Deployments
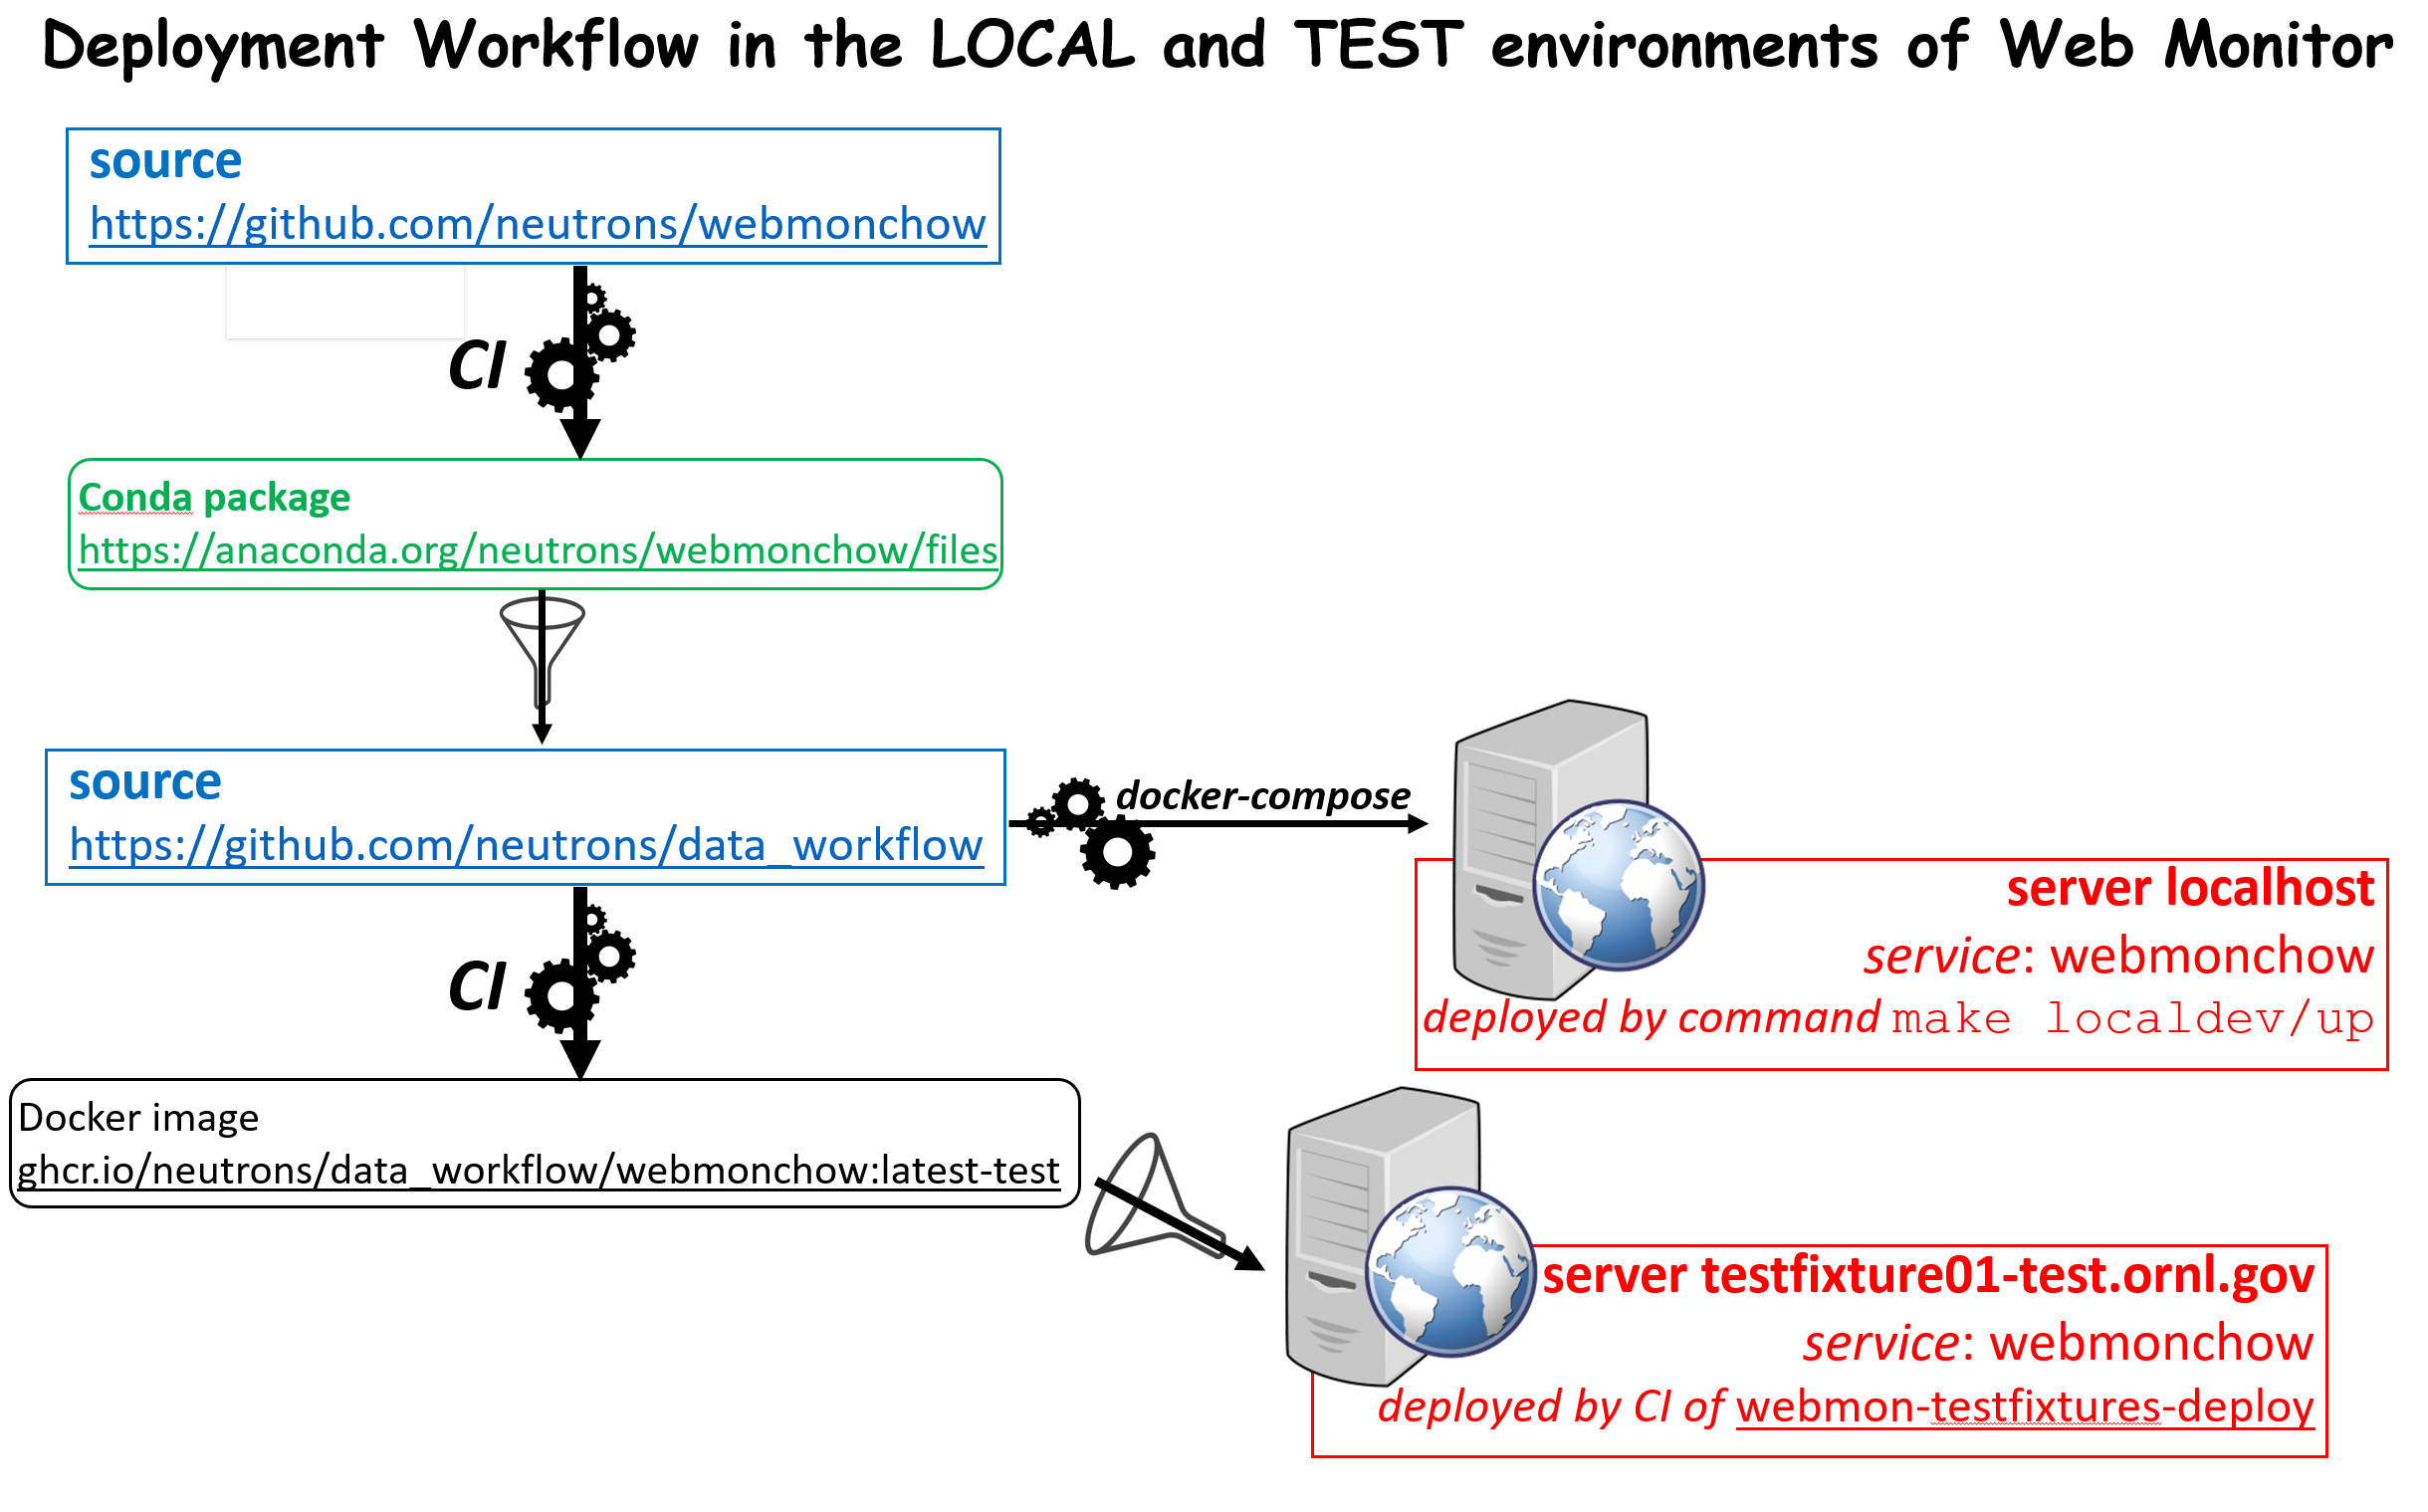
Webmonchow is deployed as a service in a Docker container, either in the local (http://localhost/) or test (http://webmon-test.ornl.gov) environments of the Web Monitor application.
Entry Points
After installation, two executable scripts are available from the command line:
$> broadcast_amq --user --password --broker --content-files
$> broadcast_pv --user --password --host --port --database-name --pv-files
Broadcast AMQ messages
Command broadcast_amq will connect to the default AMQ broker at localhost:61613. If the broker is not running, broadcast_amq will attempt to reconnect every 5 seconds indefinitely or until a prescribed number of attempts is reached. These settings can be changed by via the command line options (see broadcast_amq –help)
Messages are generated from one or more content json files. The files contain messages of different types, some of them being sent regularly with a frequency (unit of seconds) denoting the time between consecutive messages. If the frequency is 0 then the message is only sent once, at the start.
The default content files:
amq dasmon.json: heartbeat message for each instrument and message summarizing the last run for each instrument.
pvsd.json: heartbeat messages from the process variable service daemon (PVSD).
translation.json: messages indicating that certain runs are ready for auto-reduction (post-processing). In the local deployment of data_workflow, these messages are sent to the AMQ broker and will remain there until picked by the autoreducer service.
Message format
An example of the input json file is:
{
    "POSTPROCESS.DATA_READY": [
    {"frequency": 0,
     "message": {"instrument": "HYSA",
             "ipts": "IPTS-12345",
             "run_number": "321",
             "facility": "SNS",
             "data_file": "/bin/true"}},
    {"frequency": 0,
     "message": {"instrument": "HYSA",
             "ipts": "IPTS-12345",
             "run_number": "322",
             "facility": "SNS",
             "data_file": "/bin/true"}},
    {"frequency": 0,
     "message": {"instrument": "HYSA",
             "ipts": "IPTS-12345",
             "run_number": "323",
             "facility": "SNS",
             "data_file": "/bin/true"}}
    ],
    "/topic/SNS.HYSA.STATUS.DASMON": [
    {"frequency": 0.2,
     "message": {"src_name": "dasmon",
             "status": "0"}}
    ],
    "/topic/SNS.HYSA.STATUS.PVSD": [
    {"frequency": 0.2,
     "message": {"src_name": "pvstreamer",
             "status": "0"}}
    ],
    "/topic/SNS.HYSA.APP.DASMON": [
    {"frequency": 0.1,
     "message":
     {"monitors": {"1": 100, "2": 2000},
      "count_rate": 9000,
      "run_number": 324,
      "proposal_id": 12345,
      "run_title": "This is the run title",
      "recording": true}
    }
    ]
}
Broadcast PV updates
Command broadcast_pv will connect to the default postgresql database localhost:5432. If the database is not running, broadcast_pv will attempt to reconnect every 5 seconds indefinitely or until a prescribed number of attempts is reached. Once connected, broadcast_pv will send the PV updates defined in file PV dasmon.json.
These settings can be changed by via the command line options (see broadcast_pv –help) or via the environment variables defining the database settings:
DATABASE_NAME
DATABASE_USER
DATABASE_PASS
DATABASE_HOST
DATABASE_PORT
These environment variables will be defined when the data_workflow package is deployed in the local environment. (see Section Running as a Docker Service below).
The PVs are generated from an input json file. The file defines different PVs, each with a frequency (unit of seconds) denoting the time interval between updates for that particular PV. If the frequency is 0 then the PV is only sent once, at the start. Each PV also has a string defining a function that will be evaluated to generate the value of the PV. The function(x) is evaluated with x being the number of seconds since broadcast_pv started.
PVs file format
An example of the input json file is:
{
    "pvUpdate": [
        {
            "frequency": 0.1,
            "instrument": "HYSA",
            "name": "sinPV",
            "function": "100*math.sin({x}/2000)"
        },
        {
            "frequency": 0.2,
            "instrument": "HYSA",
            "name": "sawtoothPV",
            "function": "{x}%60"
        }
    ],
    "pvStringUpdate": [
        {
            "frequency": 0.01,
            "instrument": "HYSA",
            "name": "xString",
            "function": "'x = {x} seconds'"
        }
    ]
}
Installation
With conda:
$> conda activate my-environment
(my-environment)$> conda install -c neutrons webmonchow  # install latest Production version
With pip from the source repository:
$> pip install git+https://github.com/neutrons/webmonchow.git@v1.0.0#egg=webmonchow  # install tag v1.0.0
$> pip install git+https://github.com/neutrons/webmonchow.git@next#egg=webmonchow  # install tip of development
Running as a Docker Service
Webmonchow is deployed as a service in a Docker container, alongside a local deployment of the data_workflow package.
The Dockerfile:
FROM continuumio/miniconda3:23.3.1-0
RUN conda install --yes -n base conda-libmamba-solver
RUN conda install --yes --solver=libmamba -n base -c conda-forge -c neutrons postgresql=14 webmonchow=1.0.0
CMD ["sh", "-c", "broadcast_pv & broadcast_amq --broker \"activemq:61613\" & wait"]
If you are testing new features of webmonchow not yet released, you can modify the Dockerfile to install the package from the feature branch of your source repository:
FROM continuumio/miniconda3:23.3.1-0
RUN conda install --yes -n base conda-libmamba-solver
RUN conda install --yes --solver=libmamba -n base -c conda-forge postgresql=14
RUN python -m pip install git+https://github.com/neutrons/webmonchow.git@MYFEATUREBRANCH#egg=webmonchow
CMD ["sh", "-c", "broadcast_pv & broadcast_amq --broker \"activemq:61613\" & wait"]
Service webmonchow needs to be included in the docker-compose.yml file of the data_workflow package:
webmonchow:
  restart: always
  build:
    context: .
    dockerfile: Dockerfile.webmonchow
  env_file:
    - .env
  depends_on:
    db:
      condition: service_healthy
    webmon:
      condition: service_healthy
    activemq:
      condition: service_healthy
Adding a new Instrument
When the data_workflow is deployed locally alongside running webmonchow as a Docker service, and the application is served at http://localhost, the welcome page will look something like this:

The Web Monitor application shows entries only for instruments with AMQ messages defined in amq dasmon.json. Similarly, it will show PVs (e.g. http://localhost/pvmon/arcs/) only for instruments with PVs defined in PV dasmon.json. If you want additional instrument to show, you need to add content to these files. Also, if you want to signal that some runs for the instrument are ready for post-processing, you need to add them in translation.json
Adding as Active Instrument in the database
Note that for the new instrument to report the status of PVSD and DASMON correctly, i.e. show green
status boxes for all systems on the page http://localhost/dasmon/arcs, the instrument needs to be
added as an Active Instrument in the database at: http://localhost/database/dasmon/activeinstrument/.
The "src_name" in
amq dasmon.json.
must match the selection in “Has pvsd” or “Has pvstreamer” on the Active Instrument object.
